
Quantification of Amorphous 2D Materials

December 9, 2022 – Two-dimensional amorphous materials, from monolayer amorphous carbon to thin polymer films, have no unit cell that could stand in for the whole structure: every atom counts. Scientists from Ulm University and Dresden University of Technology (Germany) together with colleagues from Xi'an Shiyou University and Xi'an Jiaotong University (China) have developed a deep-learning pipeline that locates every atom in aberration-corrected HRTEM images of such materials, sorts out contaminated and multilayer regions and turns the result into bond-length, bond-angle and ring statistics, a basis for linking the structure of amorphous 2D materials to the way they are made and to what they can do.
The discovery of graphene has triggered an explosion in the development of two-dimensional (2D) materials with intriguing properties and extraordinary application potential[1], including transition metal dichalcogenides (TMDs)[2], hexagonal boron nitride (h-BN)[3] and black phosphorus (BP)[4]. In recent years, their amorphous counterparts, 2D amorphous (a-2D) materials, have experienced a resurgence[5]. The combination of atomic thinness and lack of long-range order gives a-2D materials unique properties, such as ultrahigh uniformity, excellent mechanical and chemical stability and an abundance of catalytically active sites, which promote their use in flexible electronics, electrocatalysis and energy storage[5]. Considerable effort has therefore gone into the bottom-up synthesis of a-2D materials; single-layer amorphous carbon, for example, has been grown by laser-assisted chemical vapour deposition (CVD)[6]. Because a-2D materials are only one atom thick, their atomic arrangement can be observed directly by aberration-corrected high-resolution transmission electron microscopy (HRTEM)[7],[8].
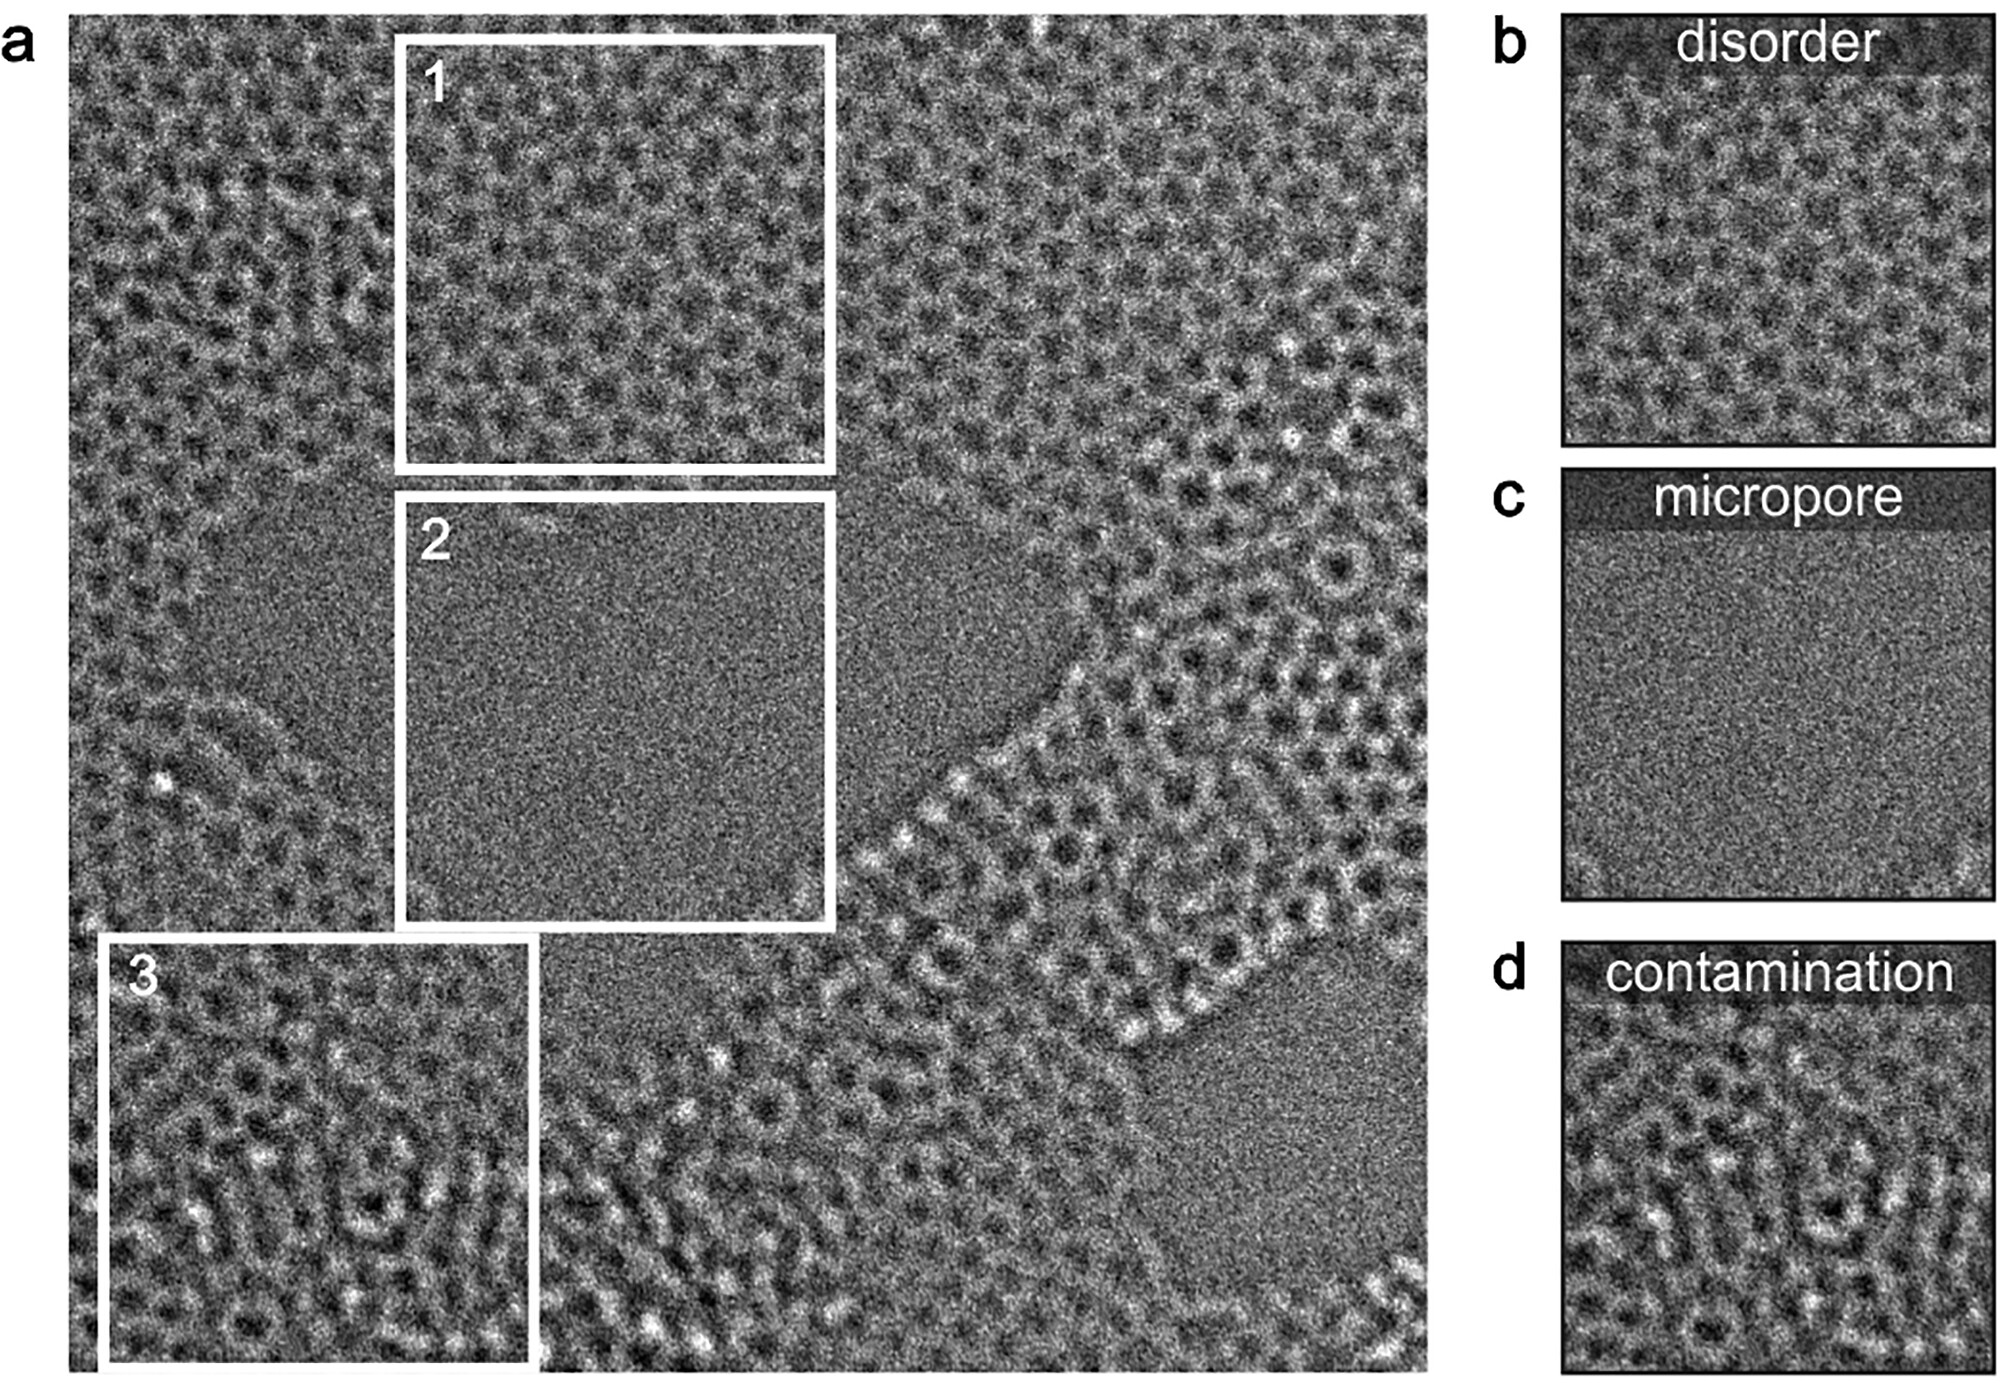
Despite the rapid development of TEM instrumentation, obtaining structural information from HRTEM images of a-2D materials is not a trivial task. In a crystal, the structure is fully described by a single unit cell and the atoms it contains. The short-range order of an a-2D material, by contrast, has to be read from the structure as a whole: each individual atom in the HRTEM image (Figs. 1a and 1b) must be located precisely. A 10 nm × 10 nm image of graphene already contains about 4000 carbon atoms, so manual labelling is extremely time-consuming. This severely limits the quantification of amorphousness and prevents structural details from being correlated with synthesis conditions and the resulting functionalities. Studies of reaction dynamics, such as the transition from an amorphous to a crystalline phase in a 2D material, require every frame of a time-resolved image series to be analysed, and the workload grows accordingly. Dedicated software tools do determine atomic positions automatically by template matching and 2D Gaussian fitting[9],[10], but they are not suited to complex structural features such as disorder and contrast variations, micropores (Fig. 1c) and surface contamination (Fig. 1d).
Neural networks have begun to close this gap. Defects and dopants have been mapped in pristine and doped graphene and in TMDs, which allows defects to be tracked dynamically in time-resolved image sequences[11]. Since 2D materials suffer from surface impurities and nanoscale fractures, a recent study addressed the segmentation of such unwanted structures in graphene images[12]. Convolutional neural networks (CNNs) have also been used to study how local defects form in graphene under various stimuli[13],[14]: Kalinin et al. revealed the structural evolution and the dynamics of defect formation in graphene under electron irradiation using variational autoencoders[14], and Trentino et al. deciphered the defect structures and their statistics in graphene after ion bombardment[13]. All of this work, however, has focused on crystalline 2D materials. The full potential of neural networks for the structural characterisation of amorphous materials remained to be explored.
Exploring the potential of neural networks
Inspired by this pioneering work, the researchers have now taken neural networks to a-2D materials. The existing CNN analyses were developed mainly for annular dark-field scanning TEM (ADF-STEM) imaging, in which the contrast depends strongly on atomic number and sample thickness. In phase-contrast HRTEM imaging, the weak Bragg scattering of an a-2D material results in a comparatively low contrast (Fig. 1a); the contrast difference between monolayer and non-monolayer regions in HRTEM (Fig. 1d), for instance, is much smaller than in ADF-STEM[15]. On the other hand, HRTEM offers excellent temporal resolution and makes fast reaction dynamics visible down to the atomic scale. With a microscope that corrects both chromatic (Cc) and spherical (Cs) aberration, the Ulm group has already followed a variety of dynamic processes, including the formation of metal crystal nuclei in carbon nanotubes[15] and the diffusion of lithium ions during lithiation and delithiation between two graphene layers[16]. A robust and versatile deep-learning pipeline that works reliably on HRTEM data sets even under less than ideal conditions was therefore highly desirable.
In the new study, the researchers developed a fully convolutional neural network (FCN) based on the U-Net architecture for the comprehensive analysis of HRTEM images of a-2D materials. The images were recorded on the Cc/Cs-corrected SALVE microscope at 60 and 80 kV. Trained exclusively on simulated images generated with an adaptive approach, the network identified the atoms in experimental images of single-layer amorphous carbon automatically, which opened the way to polygon mapping in real space and to local and statistical analyses of bond lengths and bond angles. By coupling several networks, the team built multitasking into the workflow: segmentation of multilayer regions, impurities and micropores on different length scales, and subtraction of non-uniform illumination. To probe how general the pipeline is, they then applied it to other tasks and sample systems, from the identification of defects and dopants in graphene and atomic-scale strain mapping to the statistical analysis of an amorphous polymer membrane. How the network is built is summarised in the box.
Generation of training data
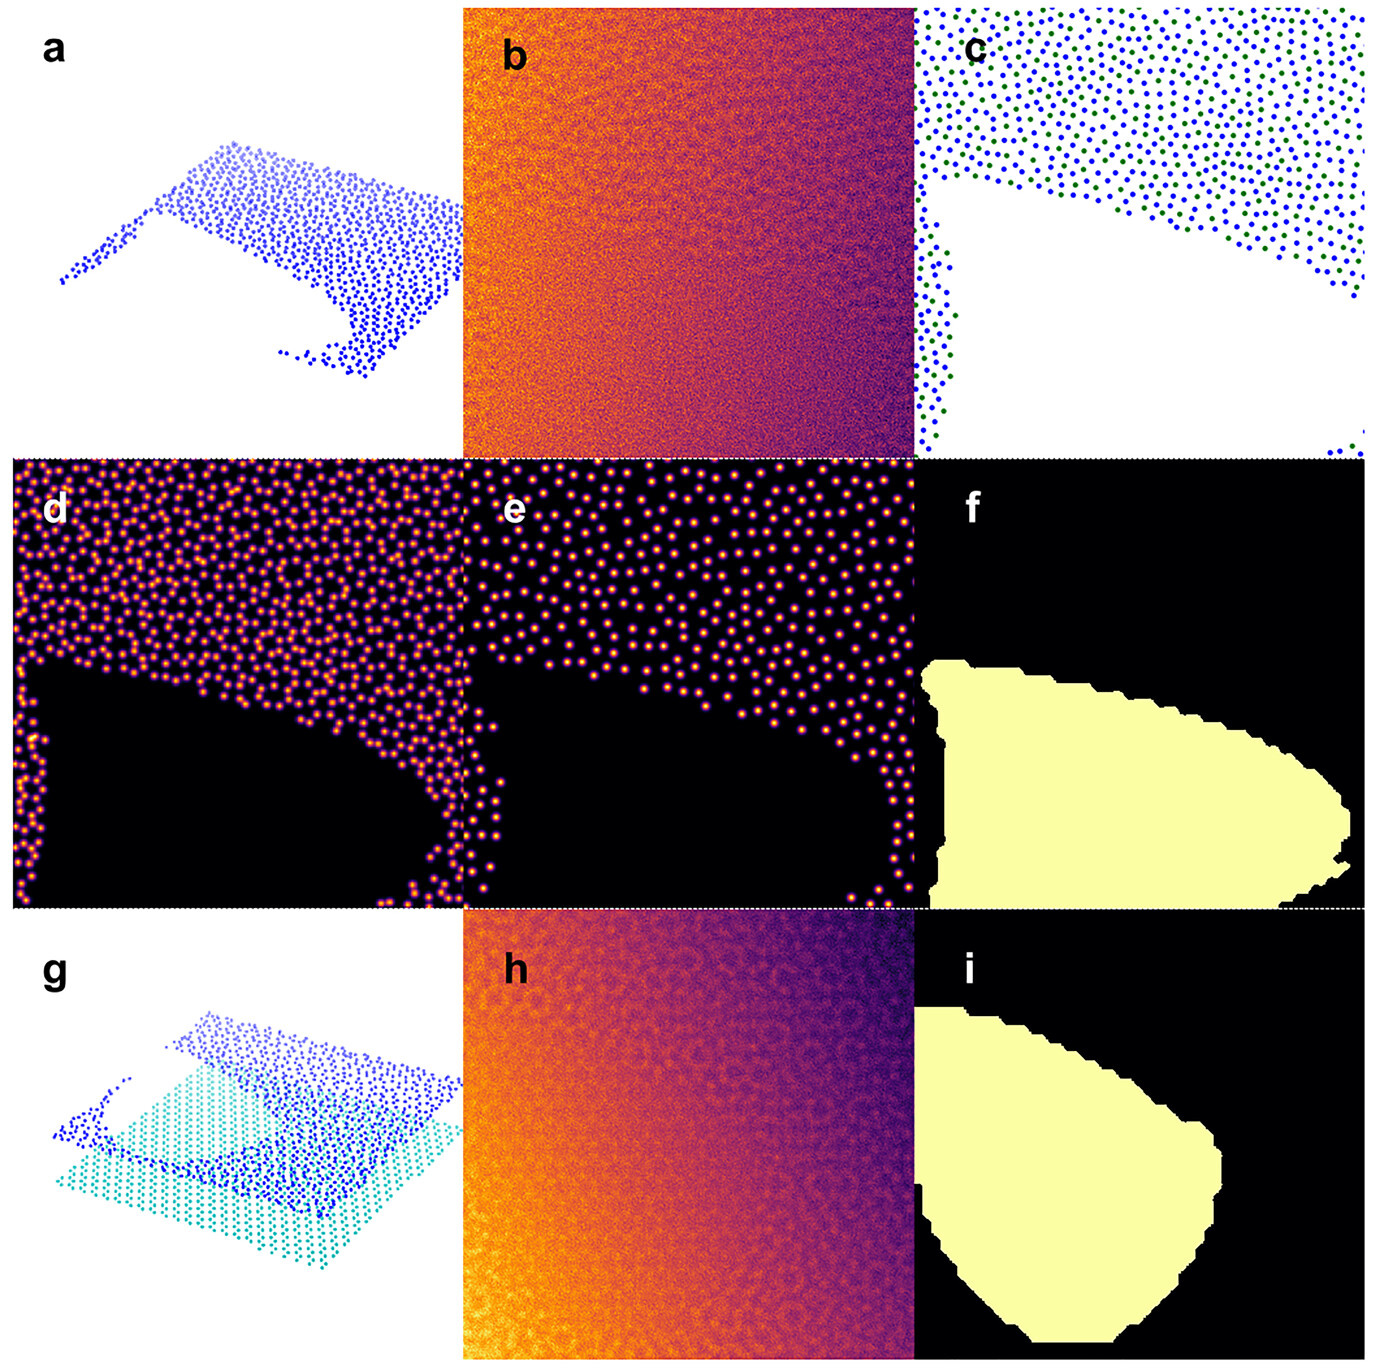
The network never saw a labelled experimental image. Its training data were created in two steps, atomic models first and image simulation second, so that the labels came for free with the model. The box describes the recipe: a semirandom carbon network with pores (Fig. 2a–f), a bilayer variant that teaches the network to recognise monolayer regions (Fig. 2g–i), and a simulated data set of 5000 images.
Automated image analysis
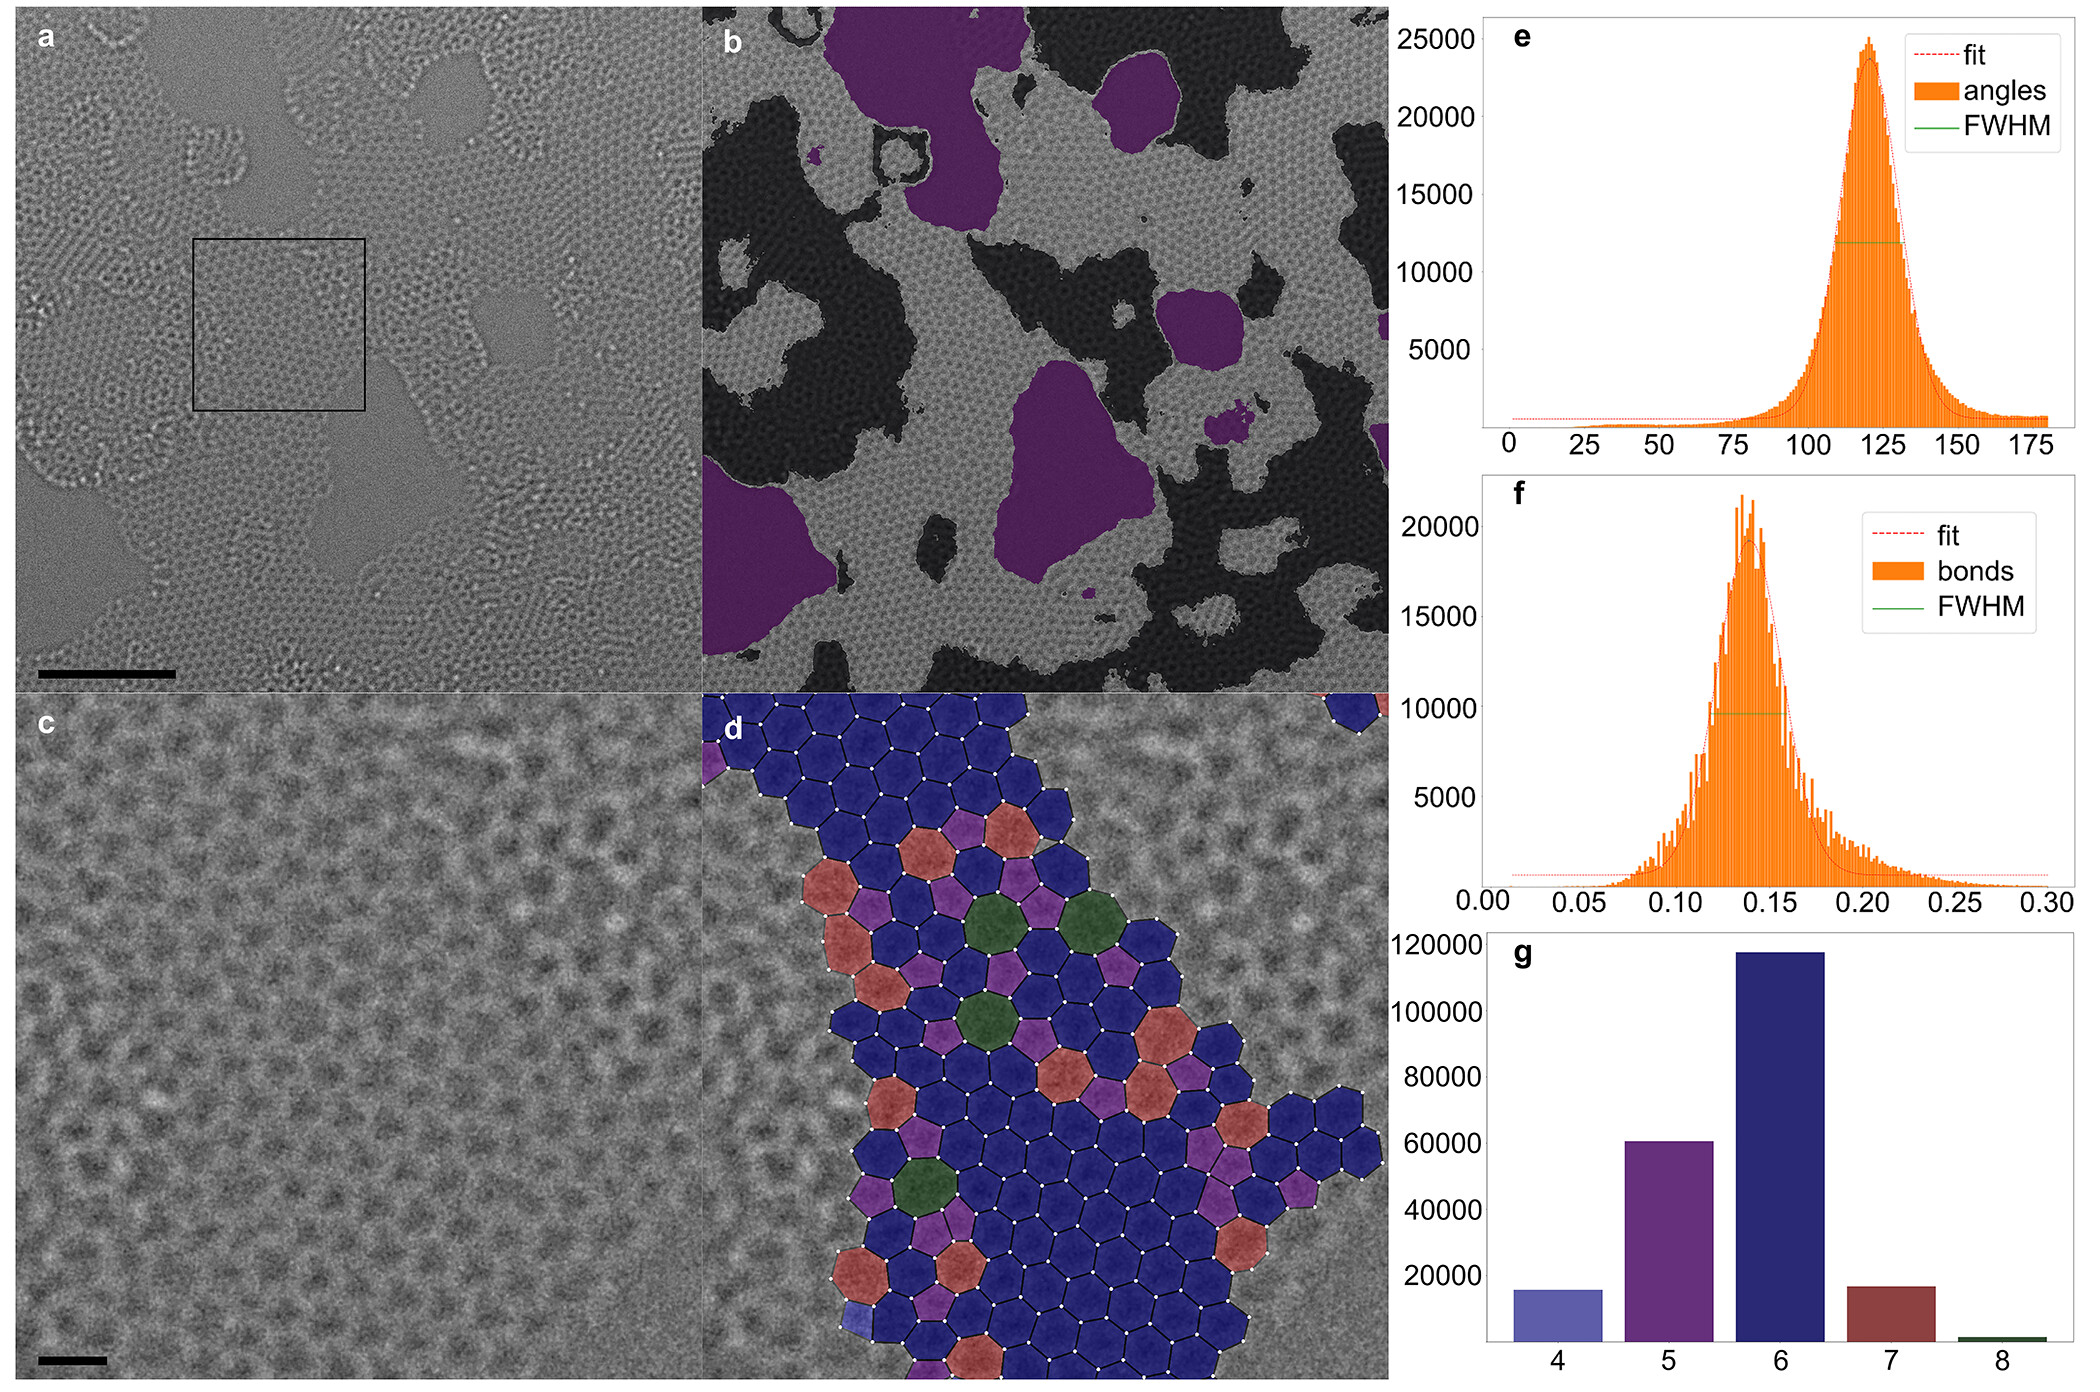
Fig. 3a shows an experimental HRTEM image of a-2D carbon with surface impurities and micropores. The FCN first determines the positions of the carbon atoms and the polygon centres across the entire image, regardless of whether a region is suitable for evaluation. A Delaunay triangulation then establishes the nearest-neighbour connections, and atoms or bonds that overlap with regions segmented as non-monolayer are deleted, which yields the output image with superimposed atom positions and polygons (Figs. 3b and 3c); the individual steps are described in the box. The FCN thus gives access to a wide range of quantitative data sets (Figs. 3d–3g). The short-range order, that is the distribution of bond lengths and bond angles, can be evaluated directly: the histograms in Figs. 3e and 3f were generated from 29 experimental images with 1.2 × 10⁶ bond angles and 7.0 × 10⁵ bond lengths in only 48 hours of computation. Because the polygon type is known from the Delaunay triangulation, carbon rings of different size are pseudocoloured, which reveals their spatial distribution and abundance in real space (Figs. 3d and 3g). The automation of such big-data analyses avoids user bias and prevents low-frequency events from being overestimated or even misinterpreted.
Deep learning pipeline
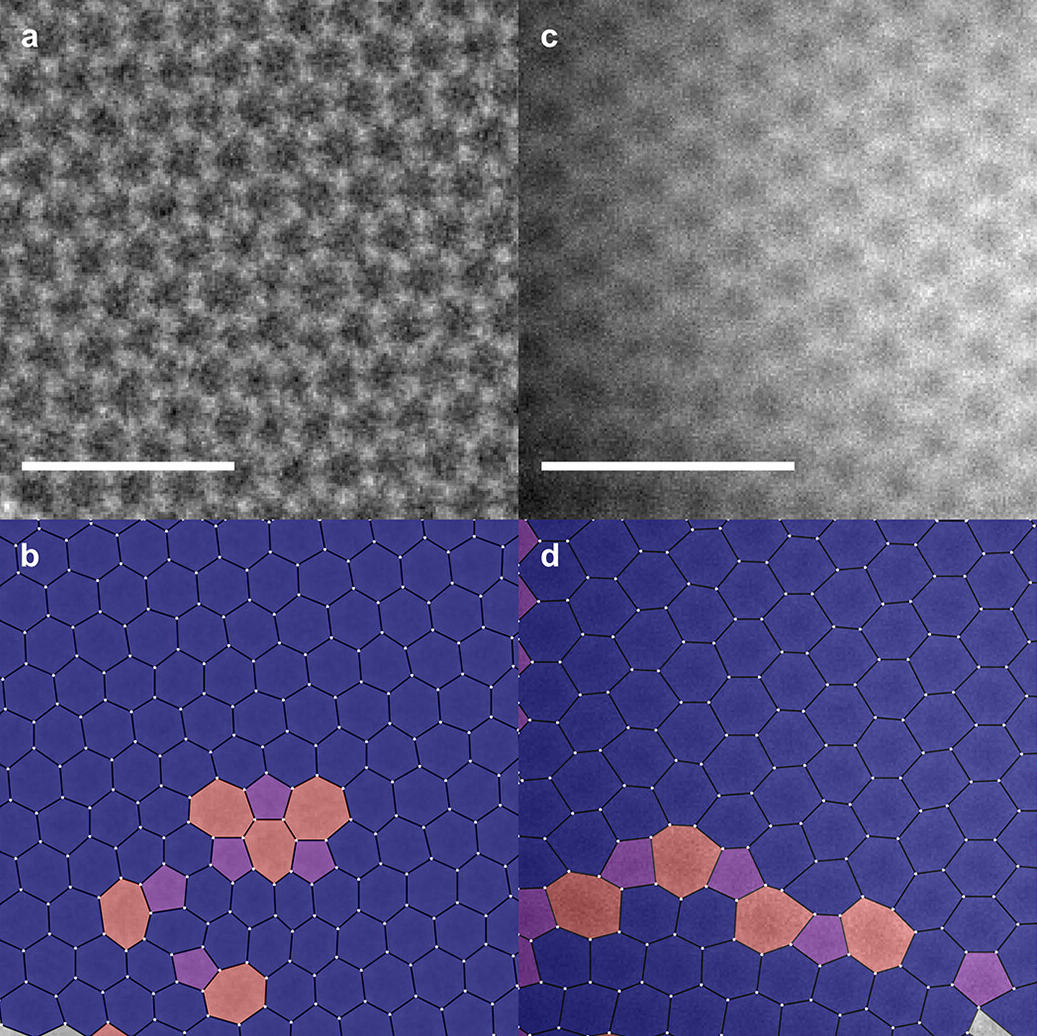
The pipeline is not restricted to amorphous carbon. Fig. 4a shows 5-7 and 555-777 defects in graphene, which the polygon map identifies at a glance (Fig. 4b), and a grain boundary (Fig. 4c) becomes visible in the same way (Fig. 4d). A bond-length map derived from the atomic positions makes local strain directly visible and thereby reveals dopant atoms, and when deep learning is applied to in situ image series, the time-dependent structural evolution of a-2D carbon can be tracked.
The researchers adapted the FCN to different materials by feeding the respective model into the training pipeline. Yet this is not always necessary, and a shortcut can be attractive when the simulation effort grows with an increasingly complex structure. The box shows how the network trained on amorphous carbon analysed the HRTEM image of an amorphous polymer film without any retraining.
In summary, the study automates the image analysis of 2D amorphous materials with a deep-learning approach. The neural network identifies atomic coordinates and segments the analysable regions with high precision, and it does so after training on simulated images alone. A semirandom atomic model with porous and bilayer regions enabled the recognition of complex features in experimental images, including disorder, micropores and surface contamination, and background intensity gradients in the training data made the network robust against inhomogeneous illumination. Applied to experimental images of single-layer amorphous carbon and of an amorphous polymer, the pipeline delivered diverse statistical data sets and a direct view of the short-range structure.
Although the pipeline was developed for amorphous materials, it readily translates to crystalline samples, where it identifies local defects and grain boundaries and maps strain. The authors anticipate that the automated quantification of short-range order will provide new insights into the structure of a-2D systems and lay the foundation for structure–property correlations in this emerging class of materials. The approach could also pave the way for an efficient and precise study of dynamic processes, such as the transition from amorphous to crystalline, amorphisation, nucleation and crystal growth.
Resource:
Leist, C., He, M., Liu, X., Kaiser, U., Qi, H. (2022).
Deep-Learning Pipeline for Statistical Quantification of Amorphous Two-Dimensional Materials.
ACS Nano 16(12), 20488–20496.
https://doi.org/10.1021/acsnano.2c06807
 Download this news article as PDF – for reading on paper, taking notes or filing.
-
Backes, C., Abdelkader, A. M., Alonso, C., Andrieux-Ledier, A., et al. (2020). Production and Processing of Graphene and Related Materials. 2D Mater., 7, 022001. https://doi.org/10.1088/2053-1583/ab1e0a
-
Manzeli, S.; Ovchinnikov, D.; Pasquier, D.; Yazyev, O. V; Kis, A. 2D transition metal dichalcogenides. Nat. Rev. Mater. 2017, 2, 17033. https://doi.org/10.1038/natrevmats.2017.33
-
Molaei, M. J.; Younas, M.; Rezakazemi, M. A Comprehensive review on recent advances in two-dimensional (2D) hexagonal boron nitride. ACS Appl. Electron. Mater. 2021, 3, 5165-5187. https://doi.org/10.1021/acsaelm.1c00720
-
Xia, F.; Wang, H.; Hwang, J. C. M.; Neto, A. H. C.; Yang, L. Black phosphorus and its isoelectronic materials. Nat. Rev. Phys. 2019, 1, 306-317. https://doi.org/10.1038/s42254-019-0043-5
-
Yang, Z., Hao, J., & Lau, S. P. (2020). Synthesis, Properties, and Applications of 2D Amorphous Inorganic Materials. J. Appl. Phys., 127, 220901. https://doi.org/10.1063/1.5144626
-
Toh, C. T.; Zhang, H.; Lin, J.; Mayorov, A. S.; Wang, Y. P.; Orofeo, C. M.; Ferry, D. B.; Andersen, H.; Kakenov, N.; Guo, Z.; Abidi, I. H.; Sims, H.; Suenaga, K.; Pantelides, S. T.; Özyilmaz, B. Synthesis and properties of free-standing monolayer amorphous carbon. Nature 2020, 577, 199-203. https://doi.org/10.1038/s41586-019-1871-2
-
Huang, P. Y.; Kurasch, S.; Srivastava, A.; Skakalova, V.; Kotakoski, J.; Krasheninnikov, A. V; Hovden, R.; Mao, Q.; Meyer, J. C.; Smet, J.; Muller, D. A.; Kaiser, U. Direct imaging of a two-dimensional silica glass on graphene. Nano Lett. 2012, 12, 1081-1086. https://doi.org/10.1021/nl204423x
-
Huang, P. Y.; Kurasch, S.; Alden, J. S.; Shekhawat, A.; Alemi, A. A.; McEuen, P. L.; Sethna, J. P.; Kaiser, U.; Muller, D. A. Imaging atomic rearrangements in two-dimensional silica glass: watching silica's dance. Science 2013, 342, 224-227. https://doi.org/10.1126/science.1242248
-
Mukherjee, D.; Miao, L.; Stone, G.; Alem, N. Mpfit: A robust method for fitting atomic resolution images with multiple Gaussian peaks. Adv. Struct. Chem. Imag. 2020, 6, 1. https://doi.org/10.1186/s40679-020-0068-y
-
Hussaini, Z.; Lin, P. A.; Natarajan, B.; Zhu, W.; Sharma, R. Determination of atomic positions from time resolved high resolution transmission electron microscopy images. Ultramicroscopy 2018, 186, 139-145. https://doi.org/10.1016/j.ultramic.2017.12.018
-
Ziatdinov, M.; Dyck, O.; Maksov, A.; Li, X.; Sang, X.; Xiao, K.; Unocic, R. R.; Vasudevan, R.; Jesse, S.; Kalinin, S. V. Deep learning of atomically resolved scanning transmission electron microscopy images: chemical identification and tracking of local transformations. ACS Nano 2017, 11, 12742-12752. https://doi.org/10.1021/acsnano.7b07504
-
Sadre, R.; Ophus, C.; Butko, A.; Weber, G. H. Deep learning segmentation of complex features in atomic-resolution phase-contrast transmission electron microscopy images. Microsc. Microanal. 2021, 27, 804-814. https://doi.org/10.1017/s1431927621000167
-
Trentino, A., Madsen, J., Mittelberger, A., Mangler, C., Susi, T., Mustonen, K., & Kotakoski, J. (2021). Structural Engineering of Graphene at the Atomic Level on a Mesoscopic Scale. Nano Lett. 21(12), 5179-5185. https://doi.org/10.1021/acs.nanolett.1c01214
-
Kalinin, S. V., Dyck, O., Jesse, S., & Ziatdinov, M. (2021). Exploring Order Parameters and Dynamical Processes in Disordered Systems Using Variational Autoencoders. Sci. Adv., 7(17), eabd5084. https://doi.org/10.1126/sciadv.abd5084
-
Cao, K.; Biskupek, J.; Stoppiello, C. T.; McSweeney, R. L.; Chamberlain, T. W.; Liu, Z.; Suenaga, K.; Skowron, S. T.; Besley, E.; Khlobystov, A. N.; Kaiser, U. Atomic mechanism of metal crystal nucleus formation in a single-walled carbon nanotube. Nat. Chem. 2020, 12, 921-928. https://doi.org/10.1038/s41557-020-0538-9
-
Kühne, M., Börrnert, F., Fecher, S., Ghorbani-Asl, M., Biskupek, J., Samuelis, D., Krasheninnikov, A. V., Kaiser, U., & Smet, J. H. (2018). Reversible Superdense Assembly of Lithium Between Two Graphene Sheets. Nature, 564, 234–239. https://doi.org/10.1038/s41586-018-0754-2
-
Shelhamer, E.; Long, J.; Darrell, T. Fully convolutional networks for semantic segmentation. IEEE Trans. Pattern Anal. Mach. Intell. 2017, 39, 3431-3440. https://doi.org/10.1109/tpami.2016.2572683
-
Quan, T. M.; Hildebrand, D. G. C.; Jeong, W. K. FusionNet: a deep fully residual convolutional neural network for image segmentation in connectomics. Front. Comput. Sci. 2021, 3, 613981. https://doi.org/10.3389/fcomp.2021.613981
-
Hjorth Larsen, A.; et al. The atomic simulation environment: a Python library for working with atoms. J. Phys. Condens. Matter 2017, 29, 273002. https://doi.org/10.1088/1361-648x/aa680e
-
Hytch, M. J. Analysis of variations in structure from high resolution electron microscope images by combining real space and Fourier space information. Microsc. Microanal. Microstruct. 1997, 8, 41-57. https://doi.org/10.1051/mmm:1997105
-
Madsen, J., & Susi, T. (2021). The abTEM Code: Transmission Electron Microscopy From First Principles. Open Res. Eur., 1, 24. https://doi.org/10.12688/openreseurope.13015.2
-
Souza Junior, J. B.; Schleder, G. R.; Bettini, J.; Nogueira, I. C.; Fazzio, A.; Leite, E. R. Pair distribution function obtained from electron diffraction: an advanced tool for structural characterization in real space. Matter 2021, 4, 441-460. https://doi.org/10.1016/j.matt.2020.10.025
-
Roorda, S.; Lewis, L. J. Comment on "The local structure of amorphous silicon." Science 2012, 338, 1539. https://doi.org/10.1126/science.1221738
-
McCulloch, D. G.; Mckenzie, D. R.; Goringe, C. M.; Cockayne, D. J. H.; Mcbride, W.; Green, D. C. Experimental and theoretical characterization of structure in thin disordered films. Acta Crystallogr. A 1999, 55, 178-187. https://doi.org/10.1107/s0108767398008769
-
Wang, Z.; Jia, X.; Zhang, P.; Liu, Y.; Qi, H.; Zhang, P.; Kaiser, U.; Reineke, S.; Dong, R.; Feng, X. Viologen-immobilized 2D polymer film enabling highly efficient electrochromic device for solar-powered smart window. Adv. Mater. 2022, 34, 2106073. https://doi.org/10.1002/adma.202106073